Graphs
Additionally, you can access the project components: the model Graph, the Graph Instances, and the datasources.
The model graph is accessed through the .graph() function:
my_project = wg.project_from_id("<Your Project ID>")
g = my_project.graph()
The Graph class inherits from the NetworkX library. This means that it is possible to create a display method according to your liking in the Graph class:
import matplotlib.pyplot as plt
"""Displays the graph using NetworkX library"""
# Using the kamada kawai layout algorithm
pos = nx.kamada_kawai_layout(g)
# Set the START node to green and the END node to red
color_mapper = {"START": "green", "END": "red"}
labels = {n: g.nodes[n]["name"] for n in g.nodes} # Use name as label
colors = [color_mapper.get(g.nodes[n]["name"], 'blue') for n in g.nodes] # Set nodes colors (default to blue)
# Draw and show the graph
nx.draw(g, pos=pos, labels=labels, node_color=colors, node_size=1000, connectionstyle='arc3,rad=0.2')
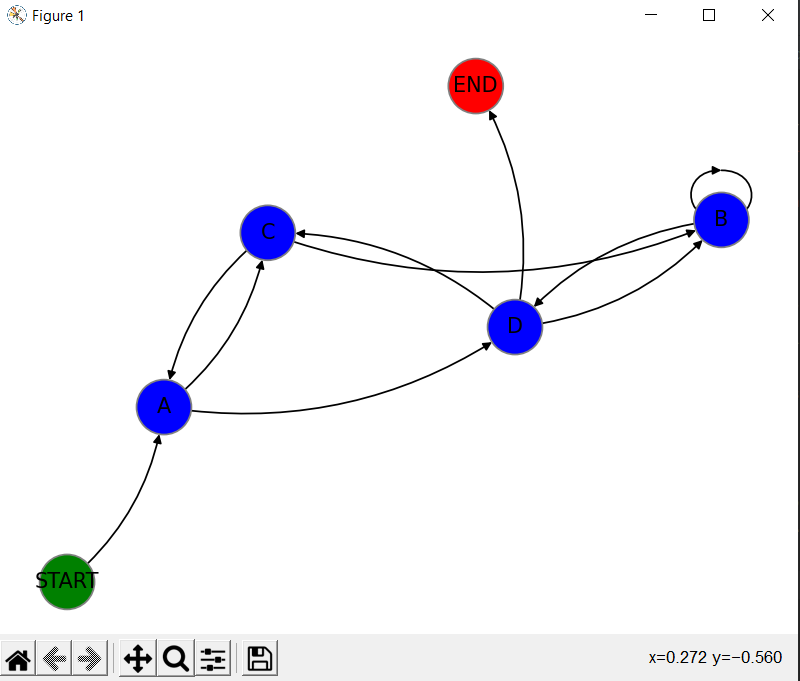
plt.show()
It will give us a graph similar to the subsequent one:
The graph can then be saved as GEXF:
nx.write_gexf(g, 'graph_name.gexf')
It can also be saved as GML:
nx.write_gml(g, 'graph_name.gml')